Multi-sensor fusion models play a crucial role in autonomous driving perception, particularly in tasks like 3D object detection and HD map construction. These models provide essential and comprehensive static environmental information for autonomous driving systems. While camera-LiDAR fusion methods have shown promising results by integrating data from both modalities, they often depend on complete sensor inputs. This reliance can lead to low robustness and potential failures when sensors are corrupted or missing, raising significant safety concerns. To tackle this challenge, we introduce the Multi-Sensor Corruption Benchmark (MSC-Bench), the first comprehensive benchmark aimed at evaluating the robustness of multi-sensor autonomous driving perception models against various sensor corruptions. Our benchmark includes 16 combinations of corruption types that disrupt both camera and LiDAR inputs, either individually or concurrently. Extensive evaluations of six 3D object detection models and four HD map construction models reveal substantial performance degradation under adverse weather conditions and sensor failures, underscoring critical safety issues. The benchmark toolkit and affiliated code and model checkpoints have been made publicly accessible.
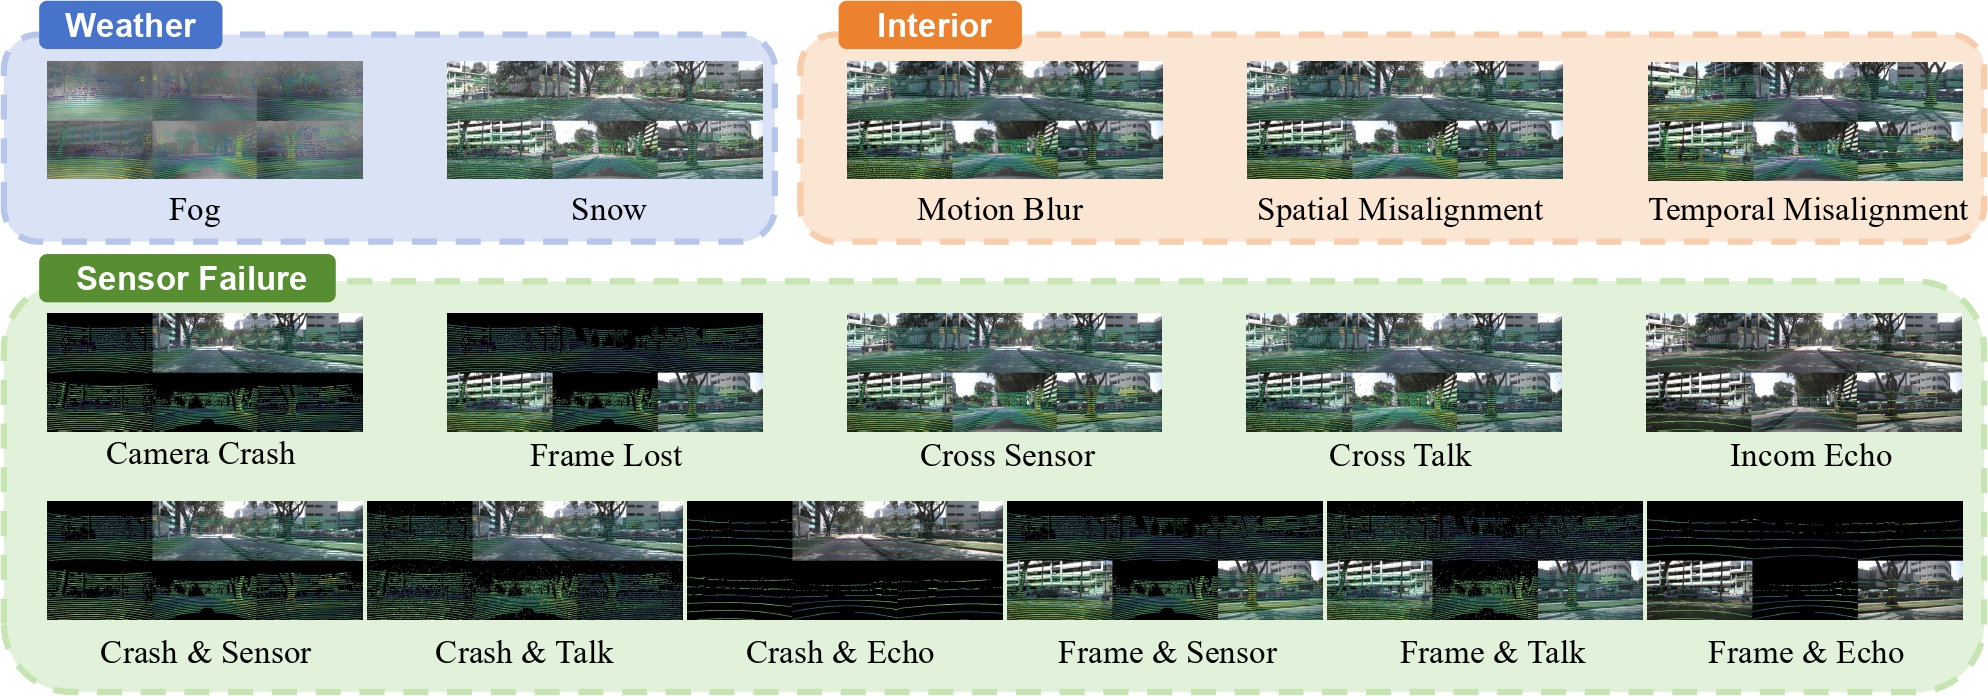
Overview of the MSC-Bench. Definitions of the multi-sensor corruptions in MSC-Bench. Our benchmark encompasses a total of 16 corruption types for multi-modal perception models, which can be categorized into weather, interior, and sensor failure scenarios.
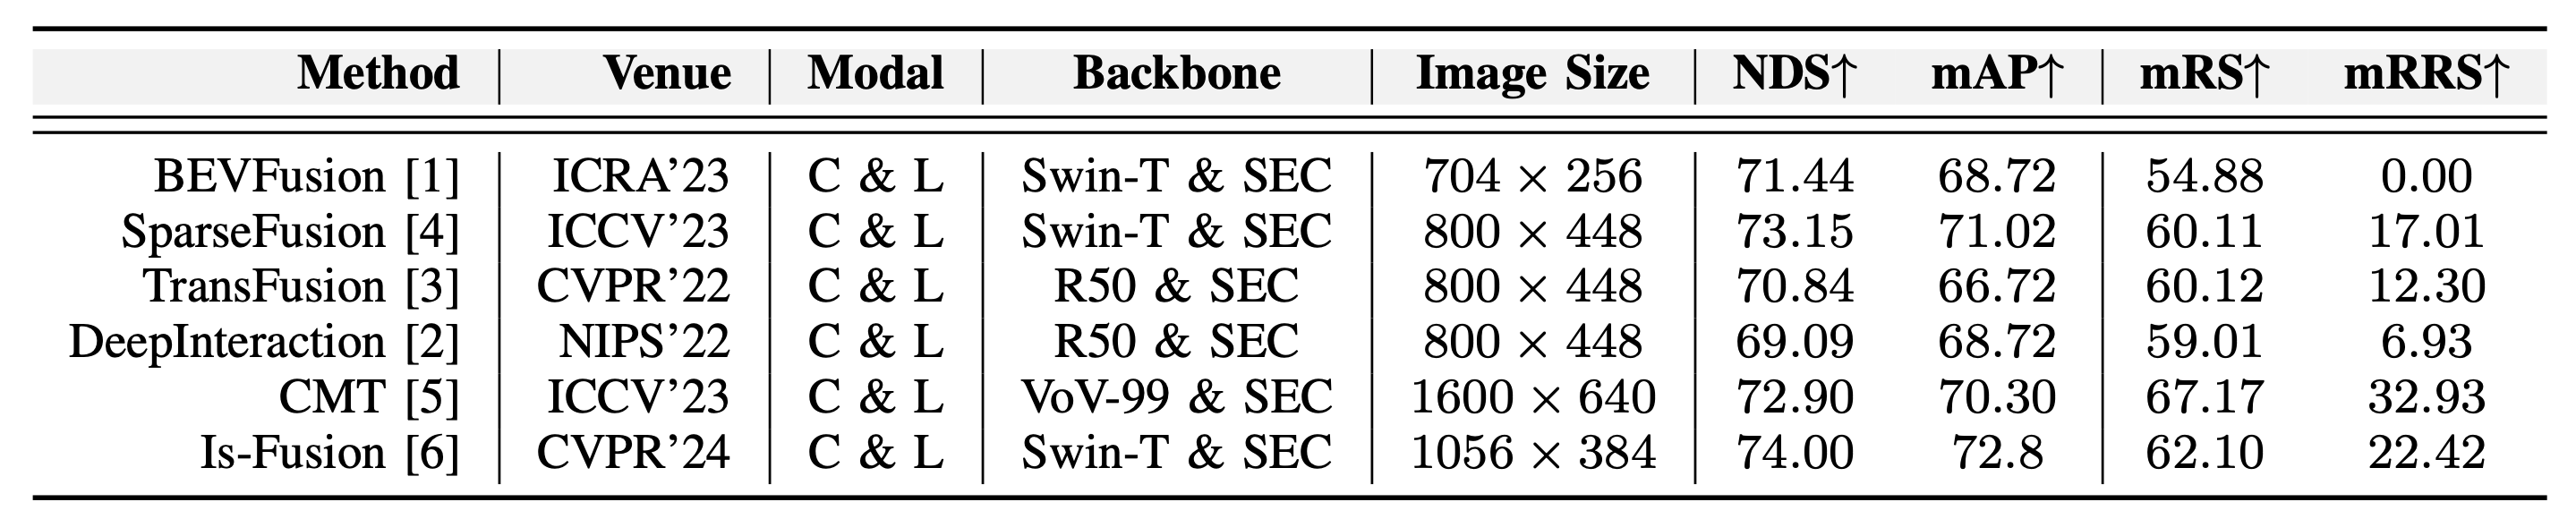
Benchmarking 3D object detection models. We report detailed information on the methods grouped by input modality, backbone, and input image size. “L” and “C” represent Lidar and Camera, respectively. ‘Swin-T”, “R50”, “VOV-99”, and “SEC” are short for Swin-Transformer, ResNet50, VovNet, and Second. We report NuScenes detection score (NDS) and mean average precision (MAP) on the official NuScenes validation set.
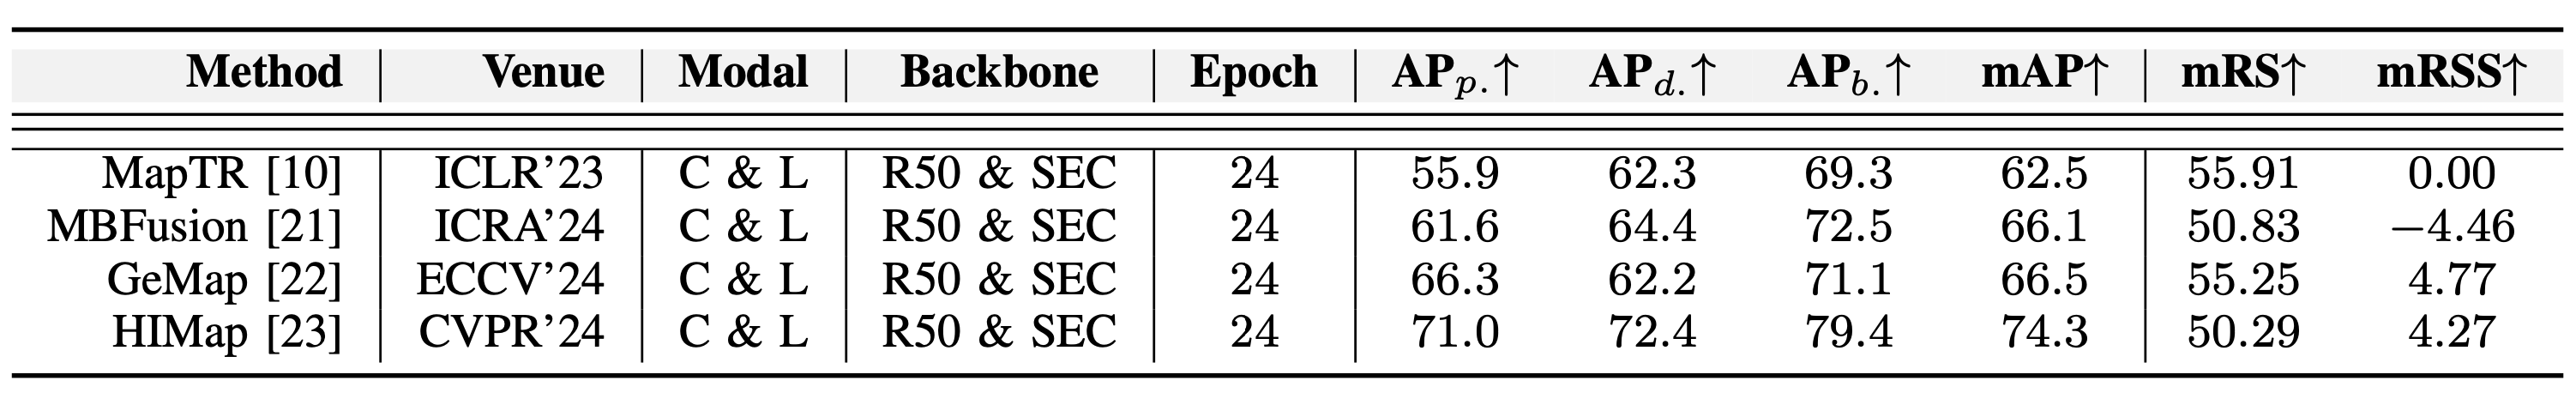
Benchmarking HD map constructors. We report detailed information on the methods grouped by input modality, BEV encoder, backbone, and training epochs. “L” and “C” represent Lidar and Camera, respectively. “Effi-B0,” “R50,” “PP,” and “SEC” refer to EfficientNet-B0, ResNet50, PointPillars, and Second. AP denotes performance on the clean NuScenes val set. The subscripts b., p., and d. denote boundary, pedestrian crossing, and divider, respectively.


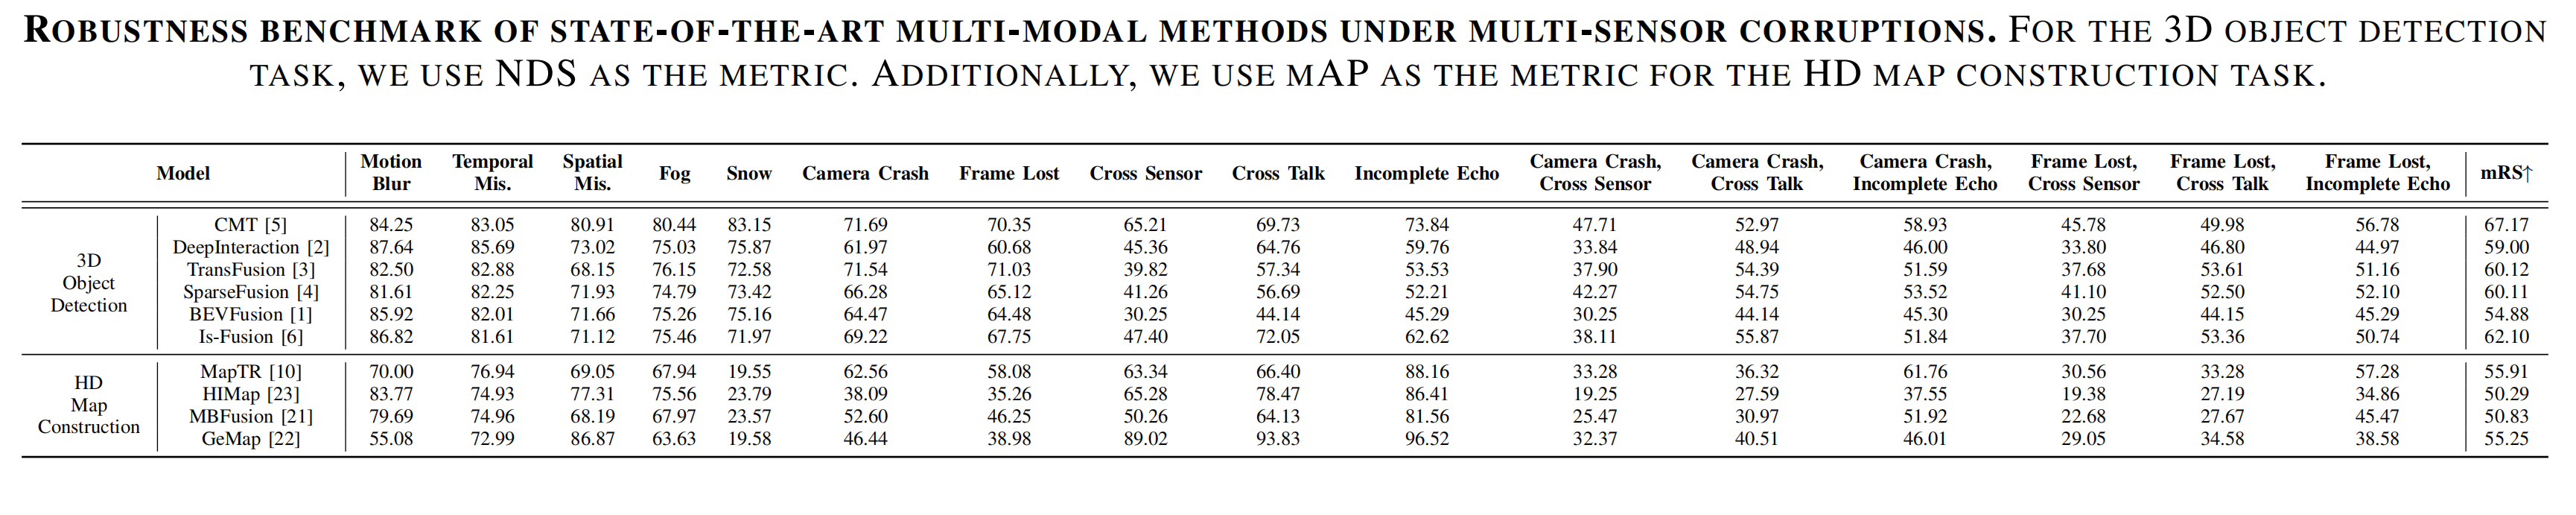
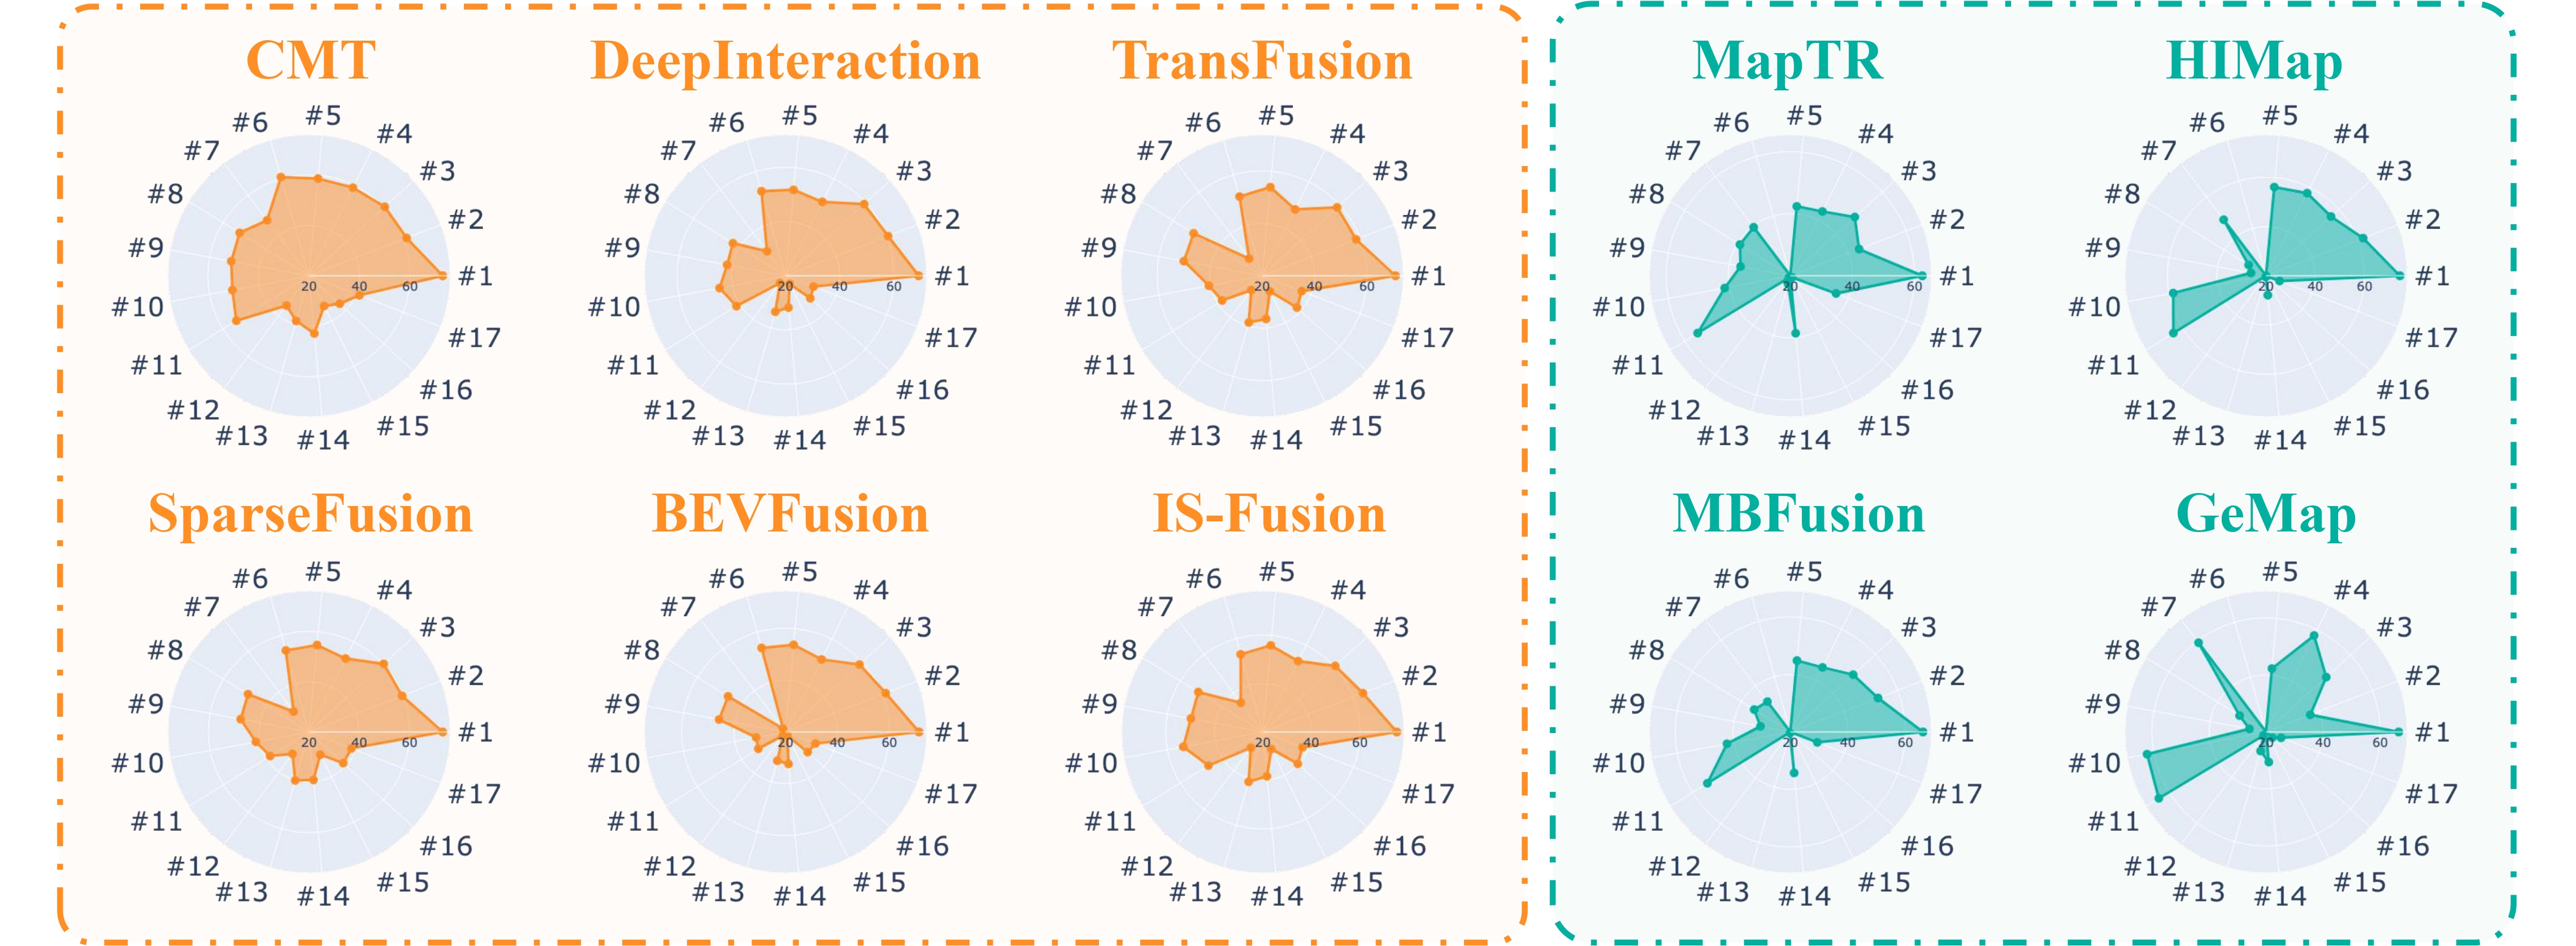
Robustness benchmark of state-of-the-art multi-modal methods under multi-sensor corruptions. For the 3D object detection task, we use NDS as the metric. Additionally, we use MAP as the metric for the HD map construction task.
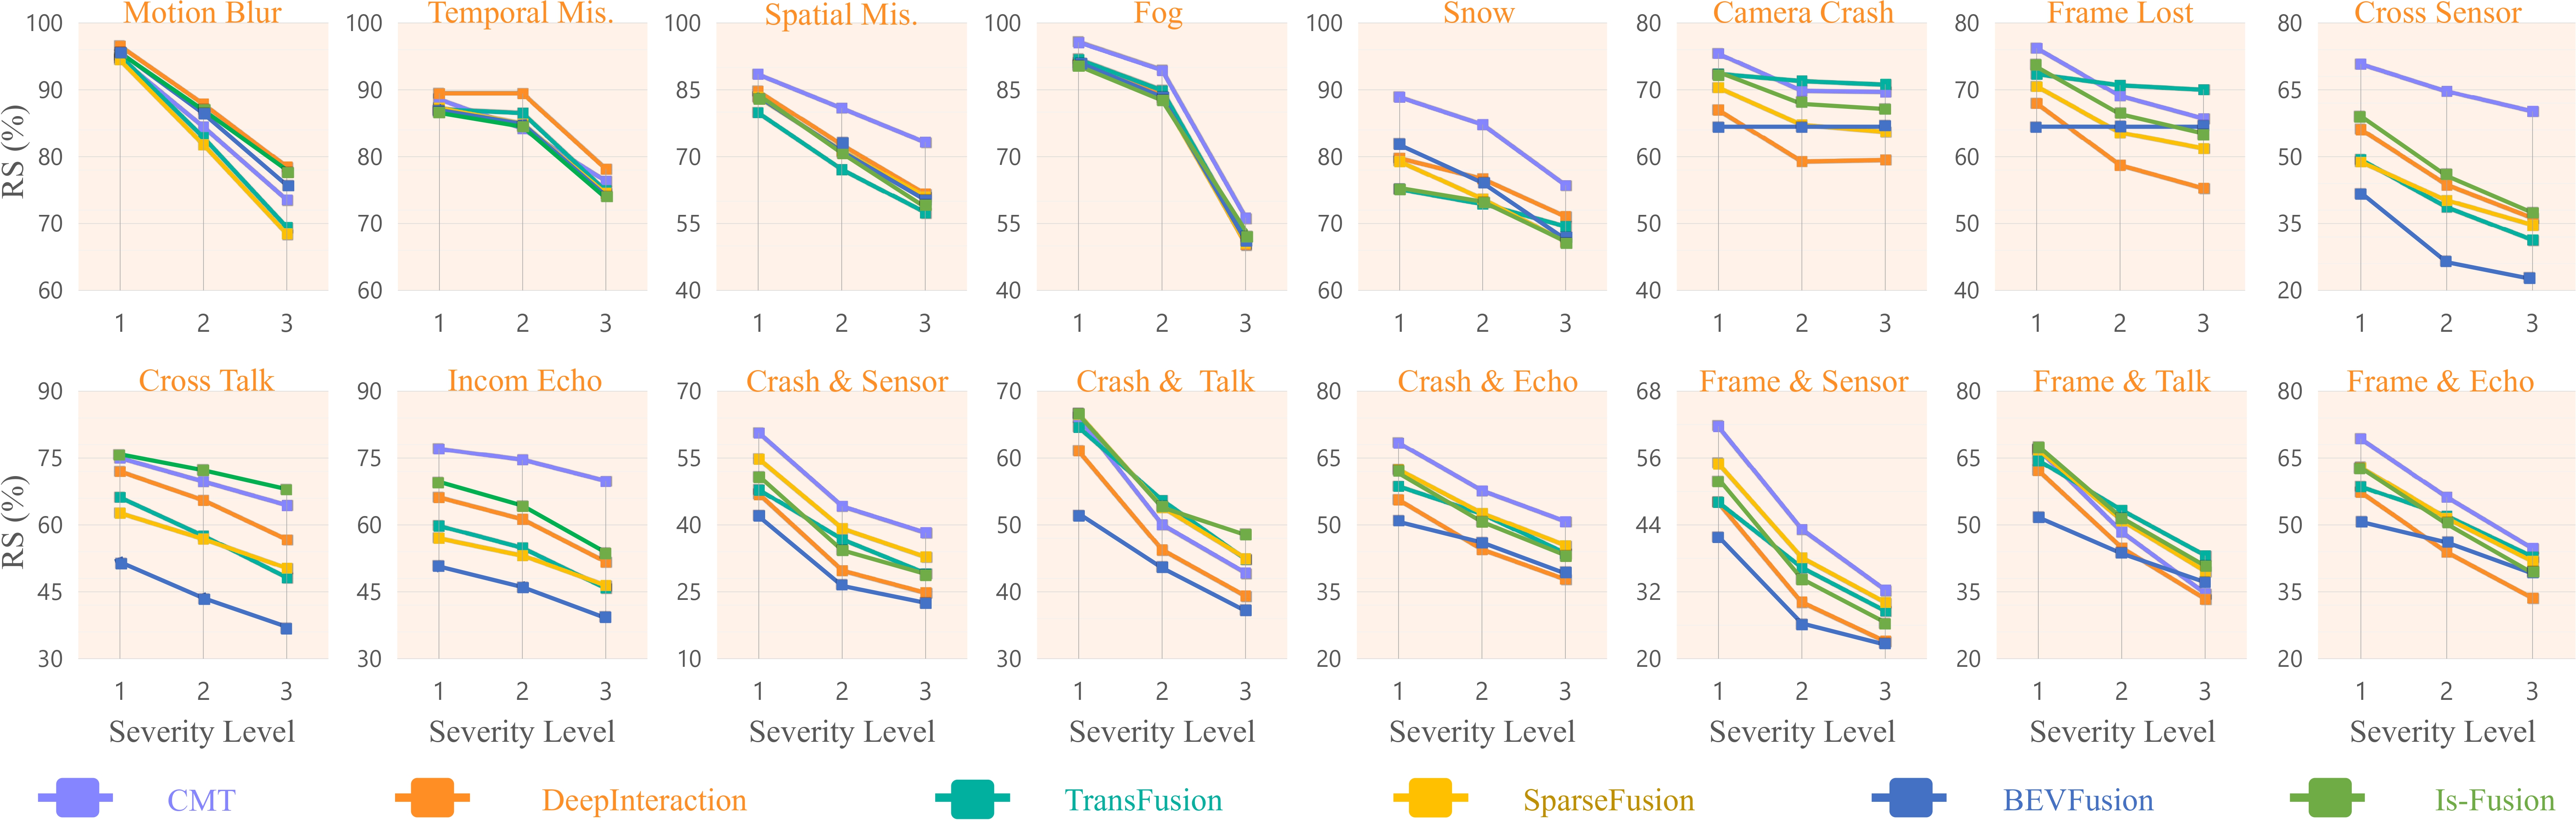
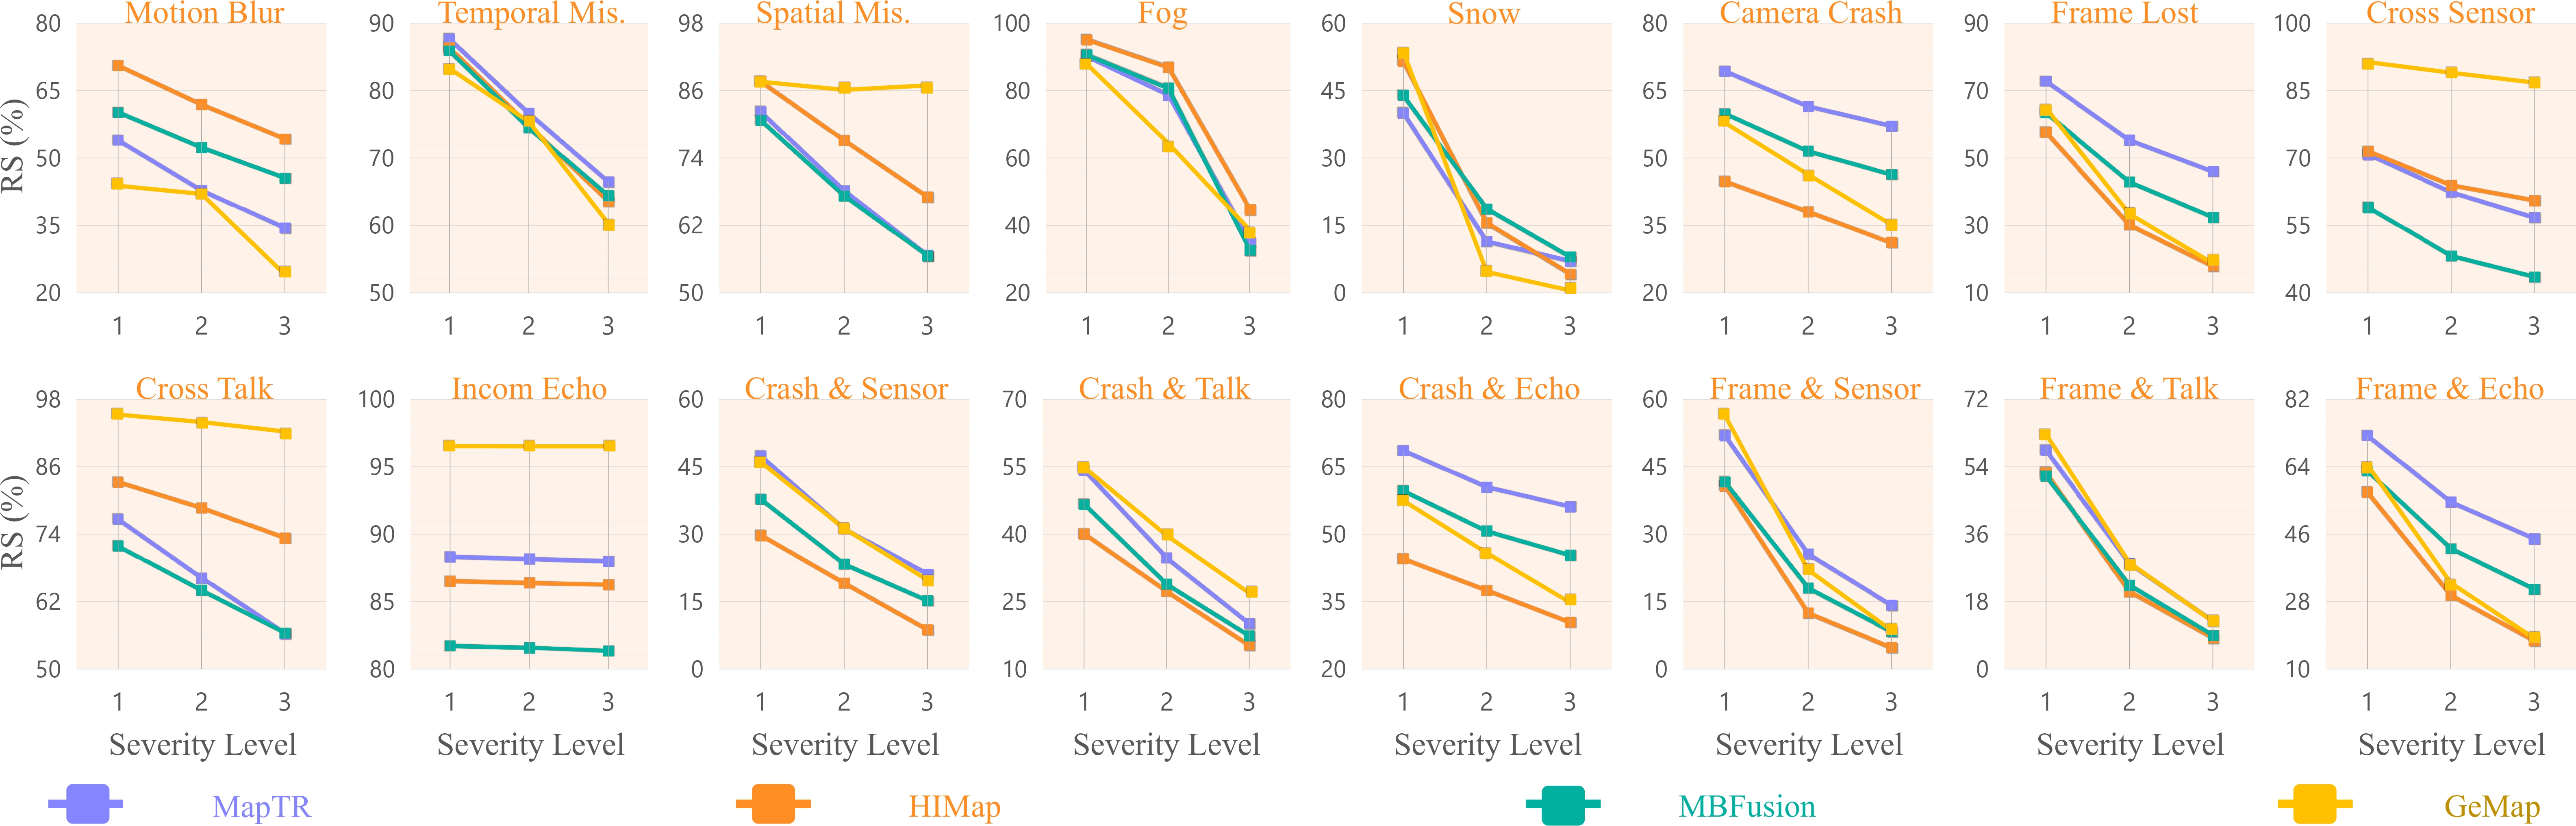
Robustness against all corruption types and severity levels in 3D object detection tasks is evaluated through the Resilience Score (RS), calculated using the NDS score for varying severity levels.
Robustness against all corruption types and severity levels in 3D object detection tasks is evaluated through the Resilience Score (RS), calculated using the NDS score for varying severity levels.
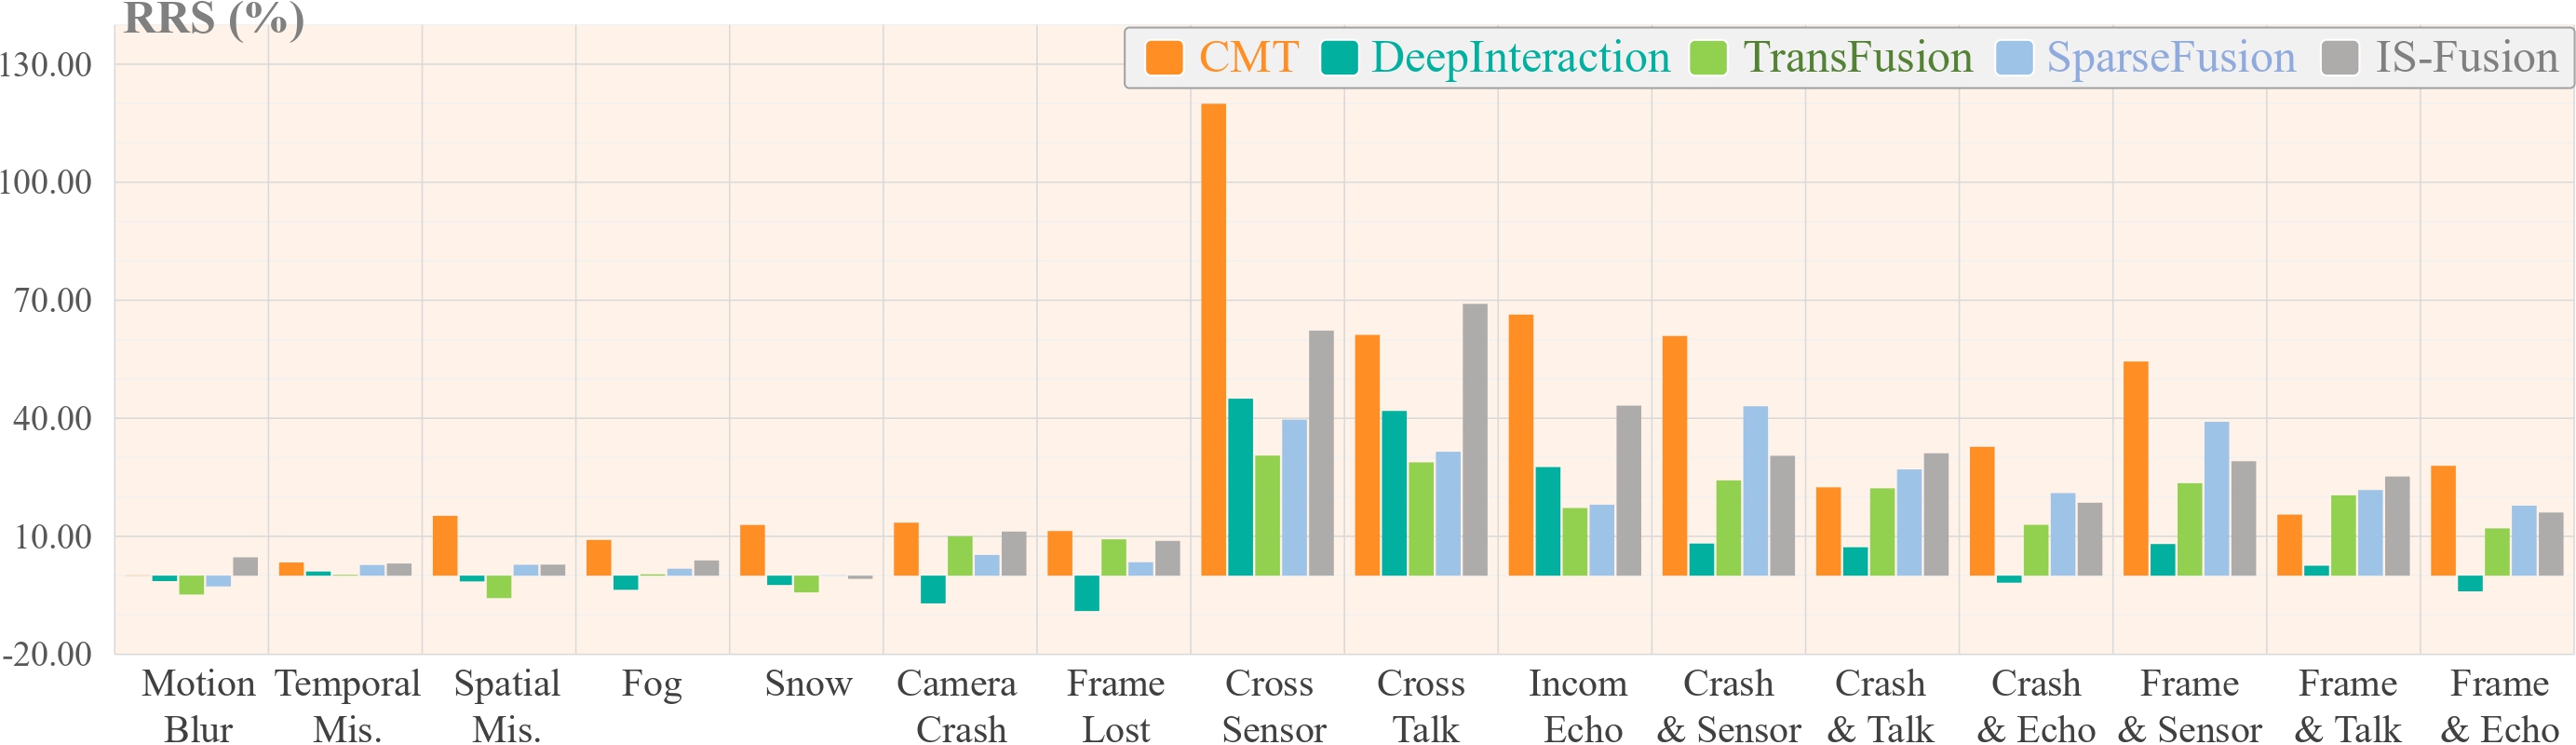
Relative robustness visualization. Relative Resilience Score (RRS) computed with NDS using BEVFusion as baseline.
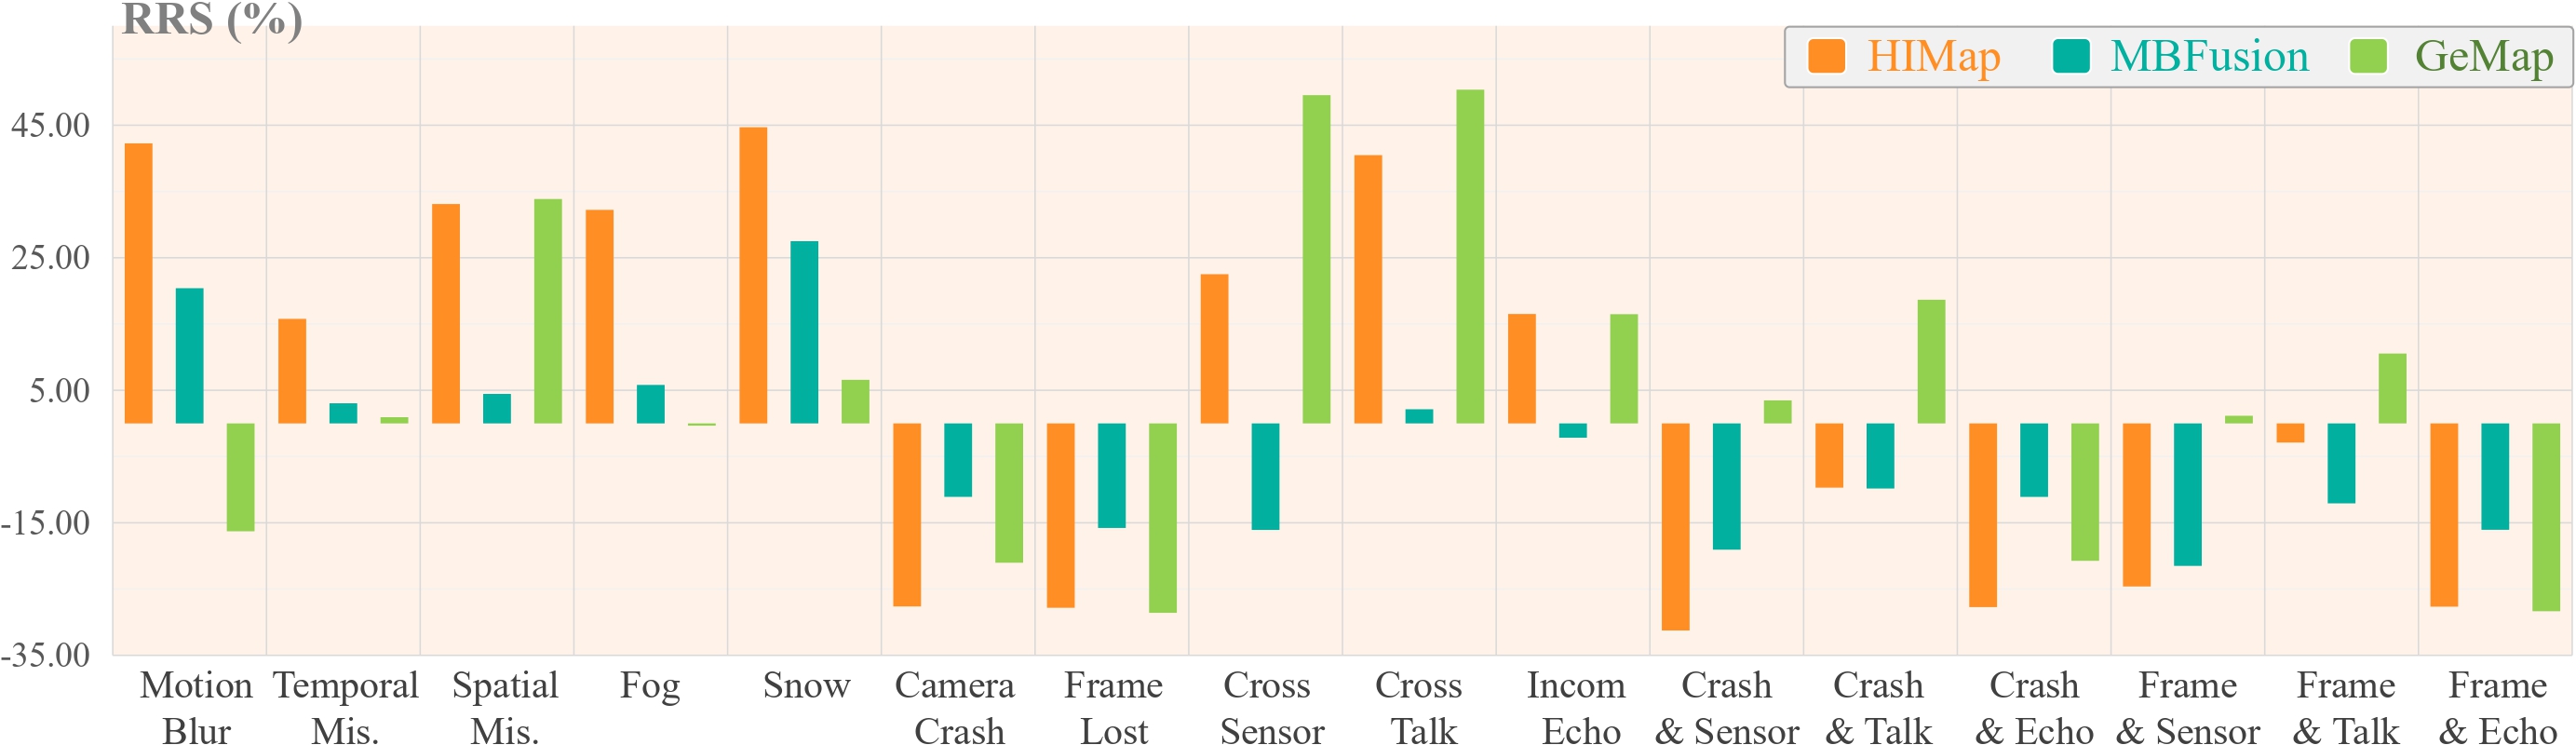
Relative robustness visualization. Relative Resilience Score (RRS) computed with mAP using MapTR as the baseline.
The datasets and benchmarks are under the Creative Commons Attribution-NonCommercial-ShareAlike 4.0 International License